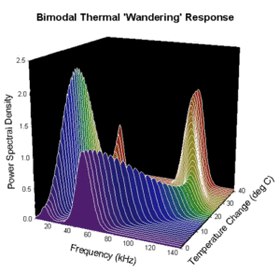
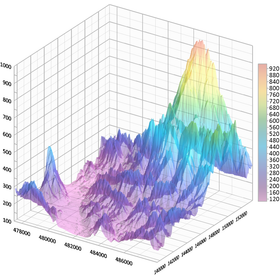
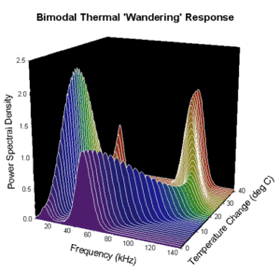
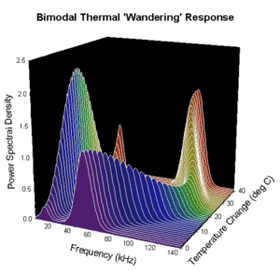
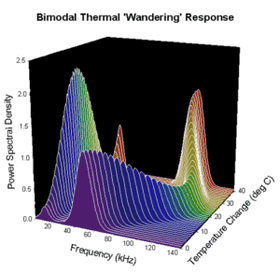
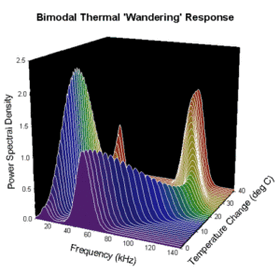
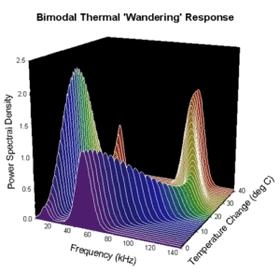
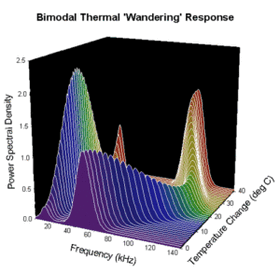
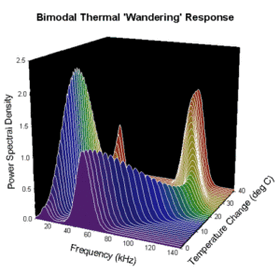
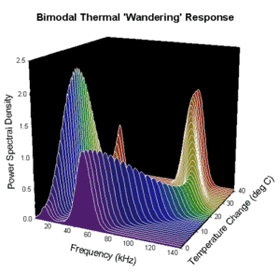
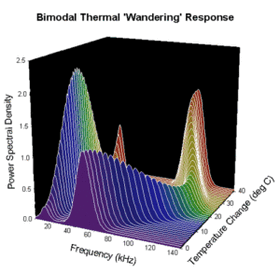
A data analysis and graph creation tool to express the research results of materials science more clearly.
In the field of materials science, it is essential to accurately grasp the properties and changes of substances and to visualize the results in an easily understandable manner. Particularly in the development of new materials and the performance evaluation of existing materials, precise analysis of experimental data and the creation of graphs that accurately represent this data significantly impact the progress of research and the quality of results presentations. Inadequate graph representation can fail to convey the meaning of the data sufficiently and may lead to misunderstandings. SigmaPlot provides researchers in materials science with the tools necessary for creating publication-quality clear graphs, detailed data analysis, and a wealth of resources for presentations, thereby supporting the accurate expression of research results.
【Usage Scenarios】
- Graphing physical property data of materials (e.g., strength, hardness, thermal conductivity, electrical conductivity, etc.)
- Trend analysis and visualization of experimental results
- Creation of high-quality graphs for papers and conference presentations
- Efficient management and analysis of complex datasets
【Benefits of Implementation】
- Objective and accurate communication of research data
- Enhanced understanding of research results and increased persuasiveness
- Improved evaluation in paper presentations and conferences
- Streamlined workflow from data analysis to graph creation
- Company:ヒューリンクス
- Price:100,000 yen-500,000 yen